Ideas? Send an e-mail! pvx@persistentralities.com. Also check my main site.
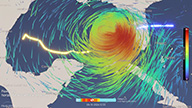
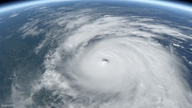
Hurricane Milton
Various real-time techniques to visualize the impact of hurricane Milton in the USA (December 2024).
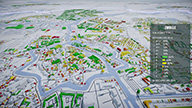
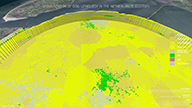
Energy labels of Dutch houses
Visualizing energy labels of various cities in the Netherlands using open data, and BAG 3D buildings. (February 2024).
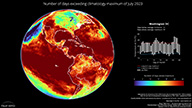
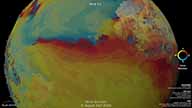
July 2023 temperature extremes
This animations shows the number of days (in July) the temperature has exceeded the average max temperature. Data from Copernicus (ERA5) (October 2023).
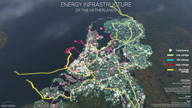
Dutch electricity infrastructure
Visualizing the different voltage level networks of the energy infrastructure in The Netherlands. (November 2022).
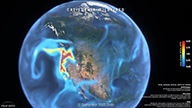
GOES-16 HD video
Animation using GOES-16 ~2TB of satellite data, showing various natural disasters in 2021. Data fetched from AWS (June 2022). UltraHD version can be seen here.
"Wind fur"
Experimental visualization of global wind using a fur shader. (March 2023).
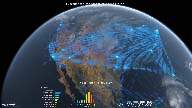
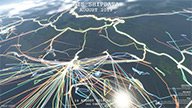
Air traffic visualization
Various experimental visualization techniques for days of air traffic data. Data from OpenSky Network (January 2022).
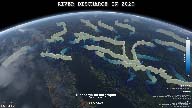
A year of river discharge (Europe)
Visualizing river discharges in 2020 using various techniques. Data from Copernicus climate data (August 2021).
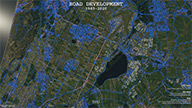
Road development (the Netherlands)
Visualizing road development in the Netherlands using data from Nationaalwegenbestand. (May 2021)

Sea ice thickness (north)
Experiment to visualize changing of ice thickness over time using different approaches. Data from CMEMS. (January 2021)
AIS Transponder data of U.S. Coast
Visualization of marine traffic of one month around the U.S coast. This data is available through Marinecadastre.gov. (December 2020)
Public transportation of a Monday
Visualization of bus, tram and train GPS locations on a Monday morning! This data is available through NS and NDOV. (November 2020)
Optical aerosol 500nm
Wild fires, hurricanes visualization using ray-marching techniques, data from ECMWF Near real-time.
(October 2020).
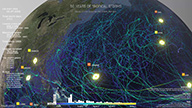
50 years of tropical storms
Based upon the National Hurricane Center storm track archive, visualization of 50 year of storm tracks.
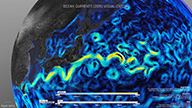
Ocean currents
Visualization of ocean currents (from CMEMS) during various seasons. GPU line generation and compute shader for integration.
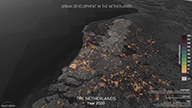
Age of buildings in the Netherlands
Visualizing the urbanization of the Netherlands using OpenStreetMaps building=* data. All buildings rendered in one view.
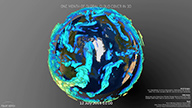
3D voxel cloud visualization
Using data from Copernicus Climate Data Store to render cloud depth layers in 3D, using voxels.
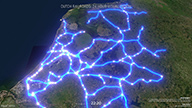
Train network visualization
Train engine and network visualization a single day of the Dutch train network. Data fetched through the NS-API.
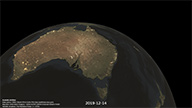
Australia bushfires
First animation that started the Polar Vertex journey: Visualization of Australian bushfires - January 2020. Using VIIRS dataset.